For strategy, finance and trading teams.

Software that maps
how the world
economy connects
to your business.

A central bank raises interest rates. Months later your customers order less. Monopole traces that chain step by step to the prices, costs and customers your business depends on.

Discuss a pilot
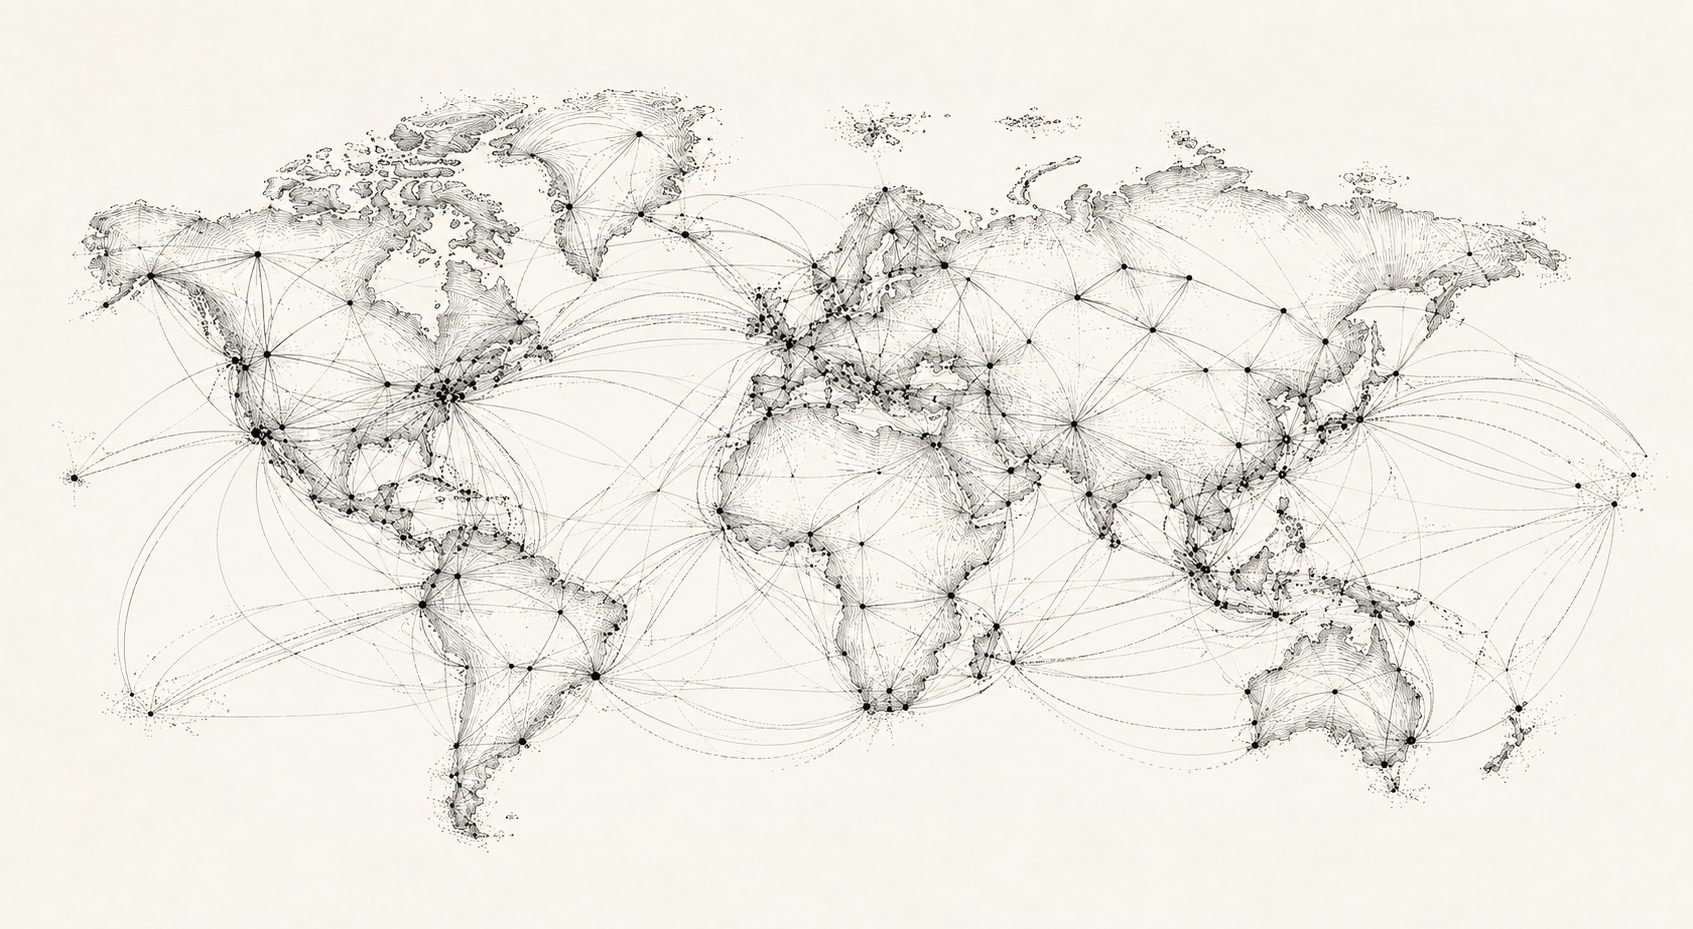
An engraved map of the world economy: trade routes and pressure lines between regions.
Plate I The world economy as one connected model

What moves the price of oil, and what it moves

What moves the price of oil, and what the price moves. Four causes on the left feed the price of a barrel of oil in the centre: how much oil the world uses pushes it up; how much is pumped, how much is in storage, and a sudden fall in demand push it down. Five effects on the right: the price pushes up how much it swings, energy share prices, inflation, new wells drilled, and the budgets of oil-exporting governments. Two effects have a second source drawn as a junction: spare storage room dampens swings, and reliance on oil money amplifies the budget effect. What moves the price What the price moves + − − − + + + + + − + How much oil the world uses demand How much oil the world pumps supply Oil in storage inventories A sudden fall in demand a pandemic, a recession Spare room in the storage tanks storage capacity How much a country relies on oil money oil-revenue dependence How much the price swings volatility Energy company share prices energy-sector equities Inflation across the economy inflation rate New wells drilled in the US shale drilling activity Oil-exporting countries’ budgets government spending The price of a barrel of oil

What moves the price

  • +How much oil the world usesdemand
  • −How much oil the world pumpssupply
  • −Oil in storageinventories
  • −A sudden fall in demanda pandemic, a recession

The price of a barrel of oil

What the price moves

  • +How much the price swingsvolatility −Spare room in the storage tanksstorage capacity
  • +Energy company share pricesenergy-sector equities
  • +Inflation across the economyinflation rate
  • +New wells drilled in the USshale drilling activity
  • +Oil-exporting countries’ budgetsgovernment spending +How much a country relies on oil moneyoil-revenue dependence

+ pushes it up. − pushes it down.

Use cases

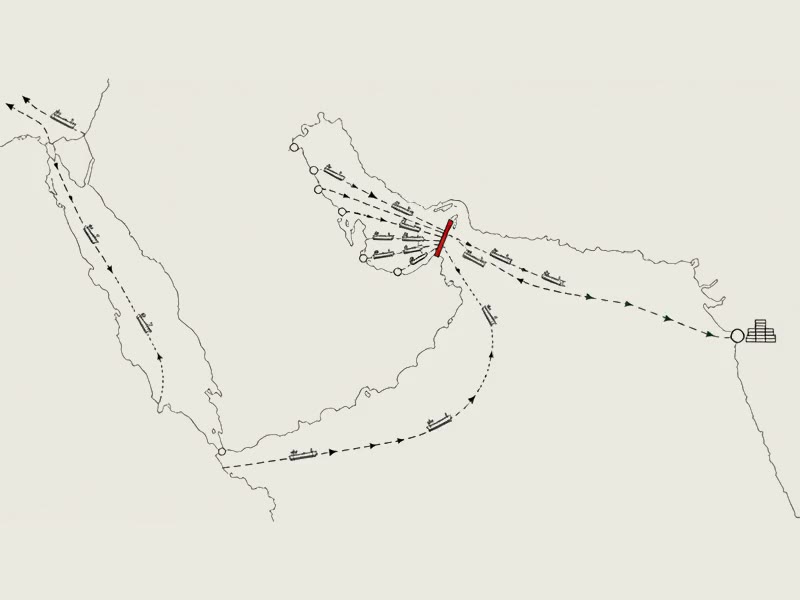
A plotting chart of the Gulf. Tanker lanes bunch behind a red bar across the Strait of Hormuz; one green lane reaches a container port.

Follow an event to your own costs

A war closes the Strait of Hormuz. Follow the chain to your own fuel and freight costs.
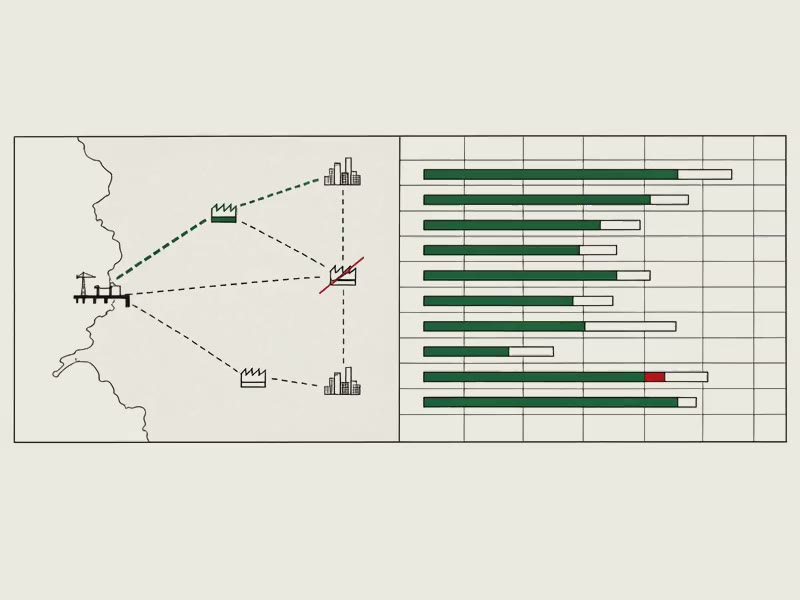
A site-selection map beside a schedule chart. The chosen factory site and its routes are green; one rejected site is struck red, and one schedule bar falls short.

Test a decision before you spend

Write a decision into the model, such as a new plant. Run it against a recession and a price spike. Then track your results against it.
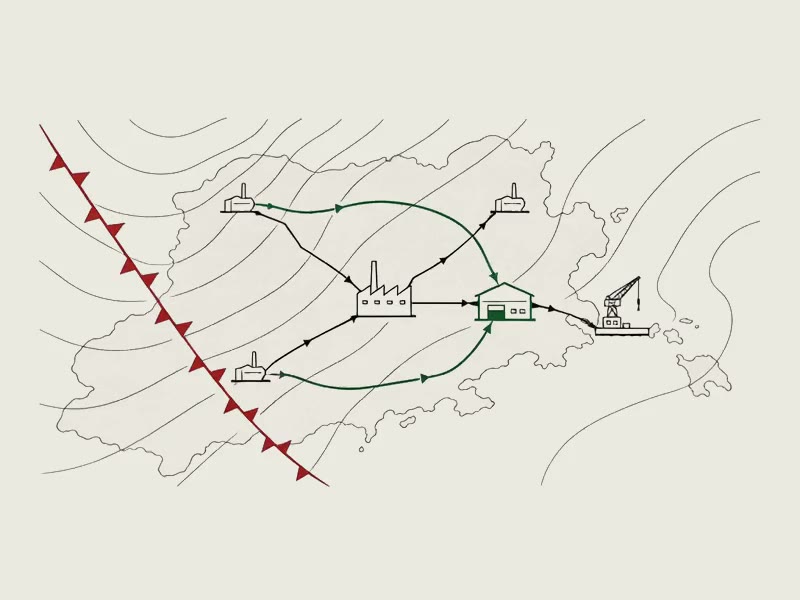
A supply-network map under a weather chart. A red front advances on a factory; its warehouse and reserve routes are green.

Plan for what you don't control

Interest rates, inflation, customer demand, fuel prices. Compare the effect of each on your costs and revenue.

The world changes.
Know what it means for your business.

A pilot starts with one question: a decision, or an event you're watching. We build it with you in the model: a map of cause and effect.

Discuss a pilot